
Product Updates
New monthly and quarterly KPI tracking!
We’re happy to announce that we now support KPIs that are tracked by monthly or quarterly periods instead of just one annual target. There are changes to the add/edit screen, and options for entering individual amounts or splitting the total annual amount between periods. The KPI chart now displays goals as a dotted line and actual results as a solid line, with the color of the health status of each update.
Step by Step Guide
- Open the KPI add/edit screen to create a new KPI or edit an existing one.
- Enter the title, description, health status, and update cadence.
- In the metric and values section, choose a goal type of Stable or Periodic.
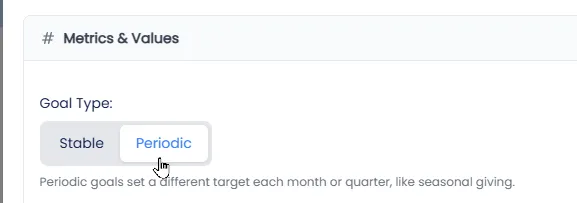
- Choose ‘Stable’ if you want one goal for the whole year, and choose ‘Periodic’ for the new monthly or quarterly goals.
- Confirm the frequency in the drop down.
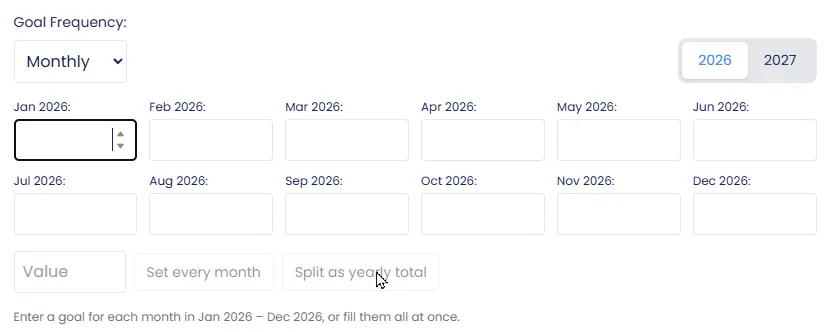
- Enter the goal amount for each individual month, or enter a yearly total and split it out across the months.
- You can also set the same amount for every month, then adjust any single month, as needed.
- Save the KPI.
- Click the KPI title to open the history view, where each month’s goal is listed and the current month is shown.
- Add an update for a month. You can backdate updates, such as adding one for September.
- Enter the actual result and select a health status, which is required before you can save the update.
- Save the update. The chart shows your goal as a dotted line and your actual update as a green dot.
- If an update was entered incorrectly, edit it to fix the value. The chart will adjust.
- Continue adding updates for other months, such as the end of August marked as needs attention, and the history line will begin to form.
- For quarterly goals, enter four goal amounts, one for each quarter.
- If you already know next year’s goals, you can add them too.
The Board report slide for KPIs now also shows the monthly or quarterly goal amounts alongside the actual reported amounts. In this example, I only entered 3 months of updates. The color block comes from the Health Status of that month’s update.

Video tutorial on how to set it up:
Pro Tip
Use Periodic goals for metrics that vary through the year, like seasonal revenue, and keep Stable for targets that stay flat. If you’re unsure where to start, enter the yearly total and split it across the months, then fine-tune individual months. Backdating updates lets you fill in past months so your history chart is useful from day one.
Closing Statement
With periodic goals, your KPIs now reflect the real rhythm of your business. Every update you log adds to a clear picture of your progress, and each month is a new chance to hit your targets. Keep building that history, and watch your results take shape.